Data analytics is one of the most essential skills in the digital era. Every organization — from startups to global companies — uses data to make accurate decisions, improve performance, and understand customers.
This guide gives you clear, reliable, and beginner-friendly information about data analytics, how it works, the tools involved, and how you can start learning it.
What Is Data Analytics?
Data analytics is the process of examining raw data to identify patterns, trends, and insights that support decision-making.
It involves:
- Collecting data
- Cleaning data
- Analyzing data
- Interpreting results
Data analytics turns raw data into meaningful insights.
With the rise of digital platforms, companies now use data to optimize marketing, increase sales, improve customer experience, and forecast future performance.
Why Is Data Analytics Important?
Organizations rely on data analytics because it brings measurable results.
Here are the main benefits:
- Helps in data-driven decision-making
- Identifies problems early
- Improves business efficiency
- Predicts future outcomes using historical data
- Enhances customer satisfaction
- Reduces operational costs
- Helps companies stay competitive
Data analytics is not optional anymore — it’s a requirement in the modern business world.
Types of Data Analytics
Understanding the four major types of data analytics helps you see how companies use data at different levels.
1. Descriptive Analytics
Explains what has already happened.
Example: Monthly revenue, number of website visitors, product sales reports.
2. Diagnostic Analytics
Explains why something happened.
Example: Sales dropped due to reduced advertising or increased competition.
3. Predictive Analytics
Predicts what is likely to happen in the future.
Example: Predicting customer behavior or expected sales next month.
4. Prescriptive Analytics
Recommends what action to take next.
Example: Suggesting the best ad strategy based on performance data.
How Does Data Analytics Work? (Step-by-Step Process)
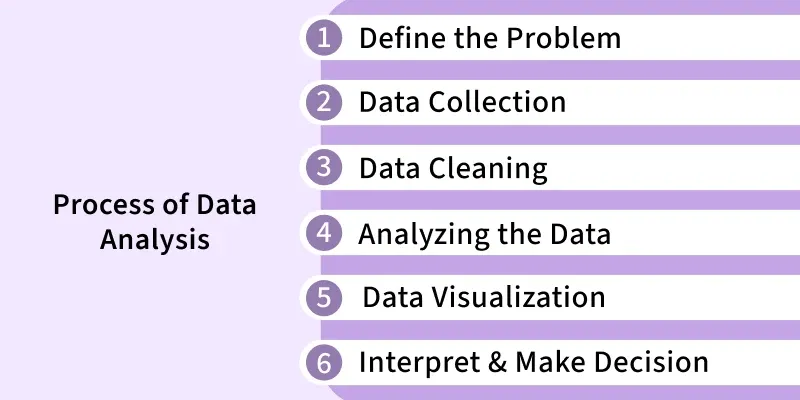
Every analytics project follows these core steps:
1. Data Collection
Data is gathered from various sources such as:
- Websites
- Mobile apps
- Social media
- CRM systems
- Surveys
- Sensors
2. Data Cleaning
Incorrect, duplicate, or incomplete data is fixed or removed.
Clean data = accurate insights.
3. Data Analysis
Different techniques like statistical analysis, trend analysis, and correlation are applied to understand the data.
4. Data Visualization
Insights are converted into charts, dashboards, and graphs for easy understanding.
5. Reporting & Decision Making
Companies use the insights to plan strategies and improve business processes.
Applications of Data Analytics
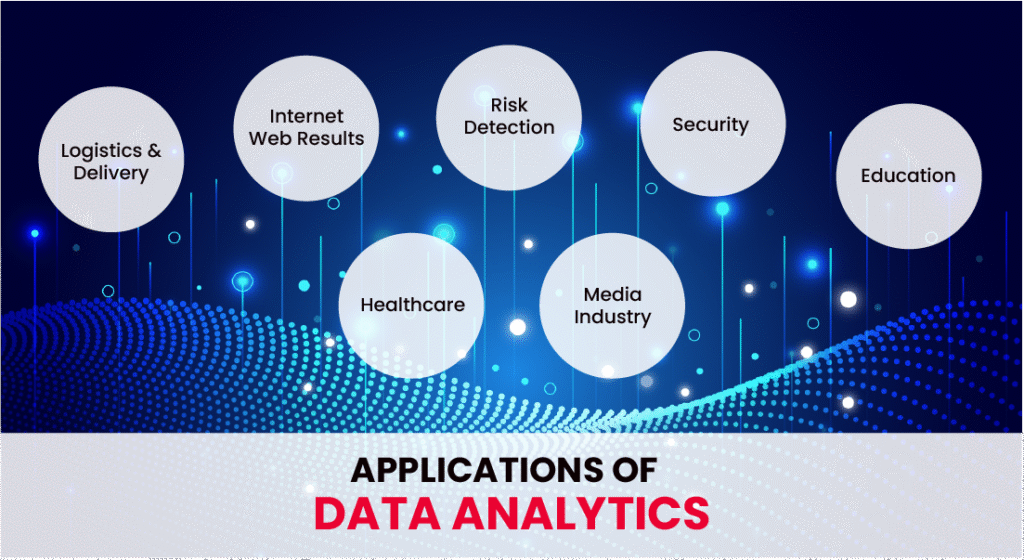
Data analytics is used in almost every industry:
1. Business & Marketing
- Customer segmentation
- Ad performance analysis
- Market trends
2. Finance
- Fraud detection
- Risk assessment
- Investment analysis
3. Healthcare
- Patient data analysis
- Diagnostic support
- Treatment predictions
4. E-commerce
- Product recommendations
- Inventory planning
- Price optimization
5. Travel & Hospitality
- Dynamic pricing
- Customer preference analysis
6. Sports
- Player performance tracking
- Match predictions
Essential Data Analytics Tools for Beginners
Here are some reliable tools widely used in the industry:
1. Excel / Google Sheets
Useful for basic analysis, formulas, and charts.
- Excel: https://www.microsoft.com/en-us/microsoft-365/excel
- Google Sheets: https://www.google.com/sheets/about/
2. SQL (Structured Query Language)
Used to extract and manage data from databases.
- Learn SQL: https://www.w3schools.com/sql/
3. Python
Popular for advanced analytics, automation, and machine learning.
- Python: https://www.python.org/
4. Power BI
Used to create dashboards and reports.
5. Google Analytics
Used to analyze website traffic and user behavior.
- Google Analytics: https://analytics.google.com/
Skills Required to Become a Data Analyst
You don’t need advanced coding in the beginning. Start with the basics:
- Understanding of statistics and math
- Proficiency in Excel or Google Sheets
- Basic knowledge of SQL
- Understanding of dashboards and data visualization tools
- Logical thinking & problem-solving
As you progress, you can learn Python, R, and machine learning concepts.
Real-Life Examples of Data Analytics
Here are some common uses:
- Netflix: Suggests shows based on your previous watch history
- Amazon: Recommends products based on your browsing and buying behavior
- Google Maps: Provides live traffic updates using millions of GPS data points
These examples show how analytics improves user experience daily.
Beginner Roadmap: How to Learn Data Analytics
Here is a practical learning path for beginners:
Step 1: Learn Excel / Google Sheets
Start with basics like formulas, pivot tables, and charts.
Step 2: Learn Basic Statistics
Focus on mean, median, mode, standard deviation, and probability.
Step 3: Learn SQL
It’s essential for extracting data from databases.
Step 4: Learn Power BI or Tableau
Visualization makes your reports more understandable.
Step 5: Practice with Real Data
Use free datasets from:
https://www.kaggle.com/datasets
Step 6: Work on Mini Projects
Examples:
- Sales performance report
- Website analytics dashboard
- Customer behavior analysis
These projects help you build a strong portfolio.
Best Free Courses for Beginners
Here are trusted and verified learning resources:
- Google Data Analytics Certificate
https://grow.google/certificates/data-analytics/ - Coursera – Data Analysis Courses
https://www.coursera.org/browse/data-science/data-analysis - IBM Data Analyst – Professional Certificate
https://www.coursera.org/professional-certificates/ibm-data-analyst - FreeCodeCamp – Data Analysis with Python
https://www.freecodecamp.org/learn/data-analysis-with-python/
Conclusion
Data analytics is a highly valuable and future-ready skill. Understanding how to analyze data helps businesses improve performance, reduce risk, and create better strategies.
The best part is that any beginner can learn data analytics, even without advanced coding skills.
Note: This blog is for educational and informational purposes only. The content provided here is based on publicly available information and general industry practices. It should not be considered as professional advice or a substitute for expert consultation.
#DataAnalytics #DataScience #BigData #AnalyticsForBeginners #BusinessIntelligence #DataDriven #MachineLearningBasics #LearnAnalytics #TechEducation #AnalyticsTools #DigitalSkills #KaggleDatasets#Carrerbook#Anslation.